TCI EPRESS RESEARCH REPORT
Market Price: ₹1551 Recommendation: BUY Target: ₹2172 Time Horizon: 1 Year
Q4FY2023 REVIEW
TCI Express Limited reported net revenue of ₹326.25 crores for the quarter ended March 31, 2023, compared to ₹298.18 crores for March 31, 2022. Profit After Tax was ₹38.85 crores for the quarter ended March 31, 2023, compared to ₹35.93 crores during the corresponding quarter of the previous year, respectively.
OVERVIEW
- 2,34,275 equity shares were repurchased by the company at an average cost of 1813.58 rupees per share, using up ₹42.48 crores (excluding transaction costs), or 56.65% of the maximum buyback size. Following the conditions of the public announcement, the Buyback Committee authorised the completion and closure of the buyback on February 13, 2023.
- To further expand into the West and South region's important growth markets and meet the region's expanding demand for services, 35 new branches were opened during FY2023.
BENCHMARK COMPARISON
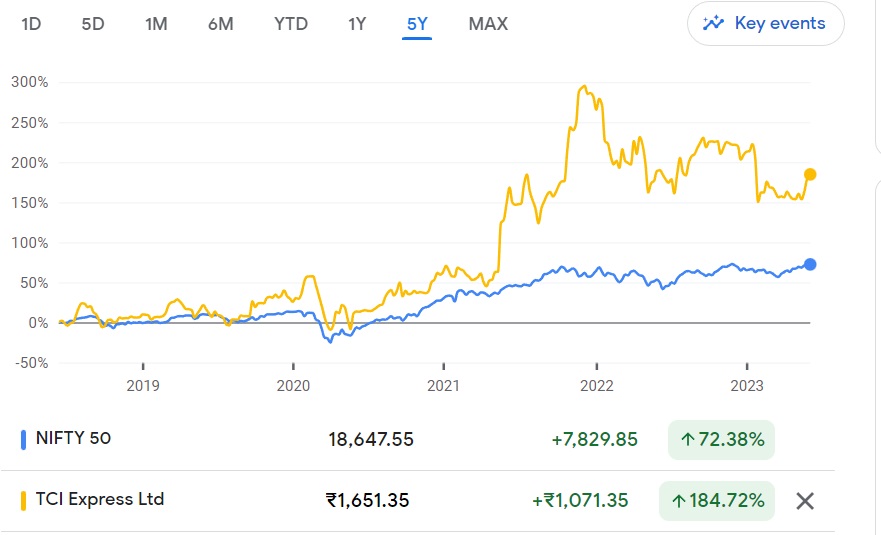
Beta: 0.84 |
Alpha: 22.40 |
Risk Reward Ratio: 1.56 |
Margin of Safety: 20% |
STOCK DATA
|
52 Week H/L |
2013/1374 |
|
Market Cap (crores) |
5,942 |
|
Face Value (₹) |
2.00 |
|
Book Value |
139.94 |
|
EPS TTM |
36.24 |
|
NSE Code |
TCIEXP |
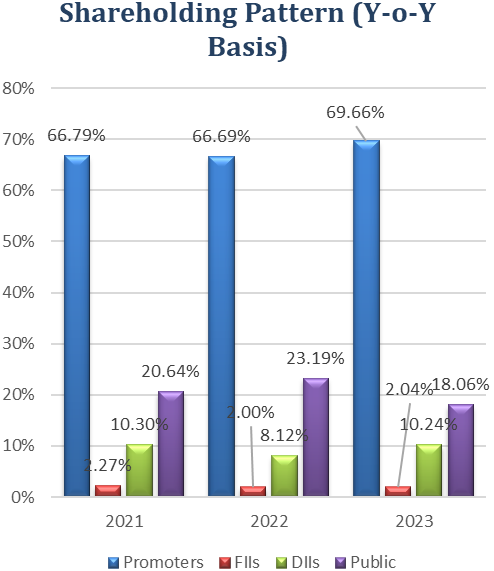
SHAREHOLDING PATTERN (%)
|
|
Sep-22 |
Dec-22 |
Mar-23 |
|
Promoter |
66.66 |
66.87 |
69.66 |
|
Public |
21.04 |
20.98 |
10.06 |
|
FIIs |
1.84 |
1.73 |
2.04 |
|
DIIs |
10.45 |
10.43 |
10.2 |
BUSINESS
- The headquarters of the logistics firm TCI Express Limited are in Gurugram, Haryana, India. It was founded in 1996 as a part of the Transport Corporation of India (TCI), and in 2007 it was separated to become a separate business.
- With a wide range of services, including local and international air and surface express, e-commerce logistics, and cold chain logistics, TCI Express is a market leader in India's express cargo distribution industry.
- Over 3,500 individuals work for the organisation, which has a network of over 40,000 pickup and delivery sites throughout India
- TCI Express is a publicly traded business whose shares are traded on the Bombay Stock Exchange and the National Stock Exchange of India.
- To meet the logistical requirements of both enterprises and people, TCI Express offers a wide range of services. Express delivery, which entails the quick transportation and distribution of products, is its main service. The firm also offers value-added solutions for e-commerce companies, including reverse logistics, cash-on-delivery, and logistical services.
- To support its activities, the firm has made significant infrastructure investments. TCI Express is the owner of a fleet of trucks and vans used only for deliveries that are outfitted with cutting-edge tracking technologies. To simplify the handling and storage of cargo, it also runs sorting facilities and warehouses that are strategically placed.
- TCI Express makes use of technology to expand its line of services and boost productivity. The firm tracks shipments in real-time and notifies consumers of their progress using sophisticated tracking technologies, barcode scanning, and electronic data exchange (EDI). Additionally, it provides online resources for managing logistics procedures and tracking client shipments.
- TCI Express is dedicated to offering its clients high-quality service, and it has won several honours, including the "Best Express Logistics Company" prize from the Indian Express Industry honours in 2012 and the Frost & Sullivan "Emerging Market Company of the Year" award in 2011.
- Customers of TCI Express range from individuals to major organisations to small and medium-sized businesses (SMEs). Customers from a range of sectors, including e-commerce, automotive, healthcare, retail, and more, make up its clientele. The firm focuses on providing tailored solutions to satisfy the unique needs of various sectors and enterprises.
SWOT ANALYSIS
STRENGTH
- A strong network of over 40,000 pickup and delivery locations across India.
- Commitment to providing a high-quality service.
- Strong financial profile.
WEAKNESS
- High operating cost.
- Lack of few awareness outside of India.
OPPORTUNITIES
- Growing Indian logistics market.
- Increasing demand for E-commerce logistics.
- growing demand for cold chain logistics.
THREAT
- Competition from other logistics companies.
- Economic slowdown.
LOGISTICS INDUSTRY ANALYSIS
- Both businesses and the economy rely heavily on logistics. A nation with a strong and effective logistics industry has an efficient forward and reverse flow of products and services, which eventually leads to a rapid expansion of the economy.
- By FY48, India is expected to expand to a US$26t economy. India's transport and logistics industry might serve as the foundation for the country's anticipated rapid expansion over the next 25 years. Road transport accounts for 66% of cargo traffic in India (measured in ton-km). Rail (31%) is followed by shipping (3%) and air (1%). Inequality in goods transportation by mode is still a problem in the sector, but it is being addressed.
- Global use of technology-enabled solutions like blockchain, big data, cloud computing, and digital twins has surged as a result of recent supply chain disruptions and rising sustainability concerns. The government of India has introduced several digital solutions, including ICEGATE and E-Logs, which have decreased inefficiencies, increased transparency, and sped up the movement of products, despite the country's relatively low level of adoption.
- The Government of India (GoI) has introduced initiatives like GatiShakti, Bharatmala, and Sagarmala to construct new transportation infrastructure, including highways, railroads, and ports. In addition to these efforts, steps are being conducted to raise private funding and adopt administrative changes that will make the planning and implementation of infrastructure improvements more efficient.
- Infrastructure development has always been supported and funded primarily by the Indian government. To speed up infrastructure development, it is implementing more and more innovative measures to draw in private and outside capital. One such tool that is anticipated to attract investment of INR 50 lakh crore (about US$650 billion) is the National Infrastructure Pipeline (NIP). Although most transport infrastructure development ventures are permitted to accept 100% FDI, significant work will still be required to achieve the intended results.
- The shipping and logistics industry in India is also compliant with national and international laws on sustainable practices. The industry is making efforts to comply with important international standards such as the Emissions Trading System, Carbon Intensity Rating, and Energy Efficiency Existing Ship Index.
FINANCIAL OVERVIEW
QUARTERLY SUMMARY
|
Quarterly (INR in crores) |
Mar-23 |
Dec-22 |
Sep-22 |
Jun-22 |
Mar-22 |
|
Revenue from Operations |
326.25 |
314.42 |
309.90 |
290.44 |
298.18 |
|
Other income |
1.67 |
1.30 |
2.27 |
1.93 |
2.10 |
|
Total Income |
327.92 |
315.72 |
312.17 |
292.37 |
300.28 |
|
|
|
|
|
|
|
|
Total Expenditure |
276.31 |
272.63 |
261.91 |
250.98 |
251.14 |
|
EBIT |
51.61 |
43.09 |
50.26 |
41.39 |
49.14 |
|
|
|
|
|
|
|
|
Finance cost |
0.74 |
0.44 |
0.35 |
0.29 |
0.29 |
|
PBT Before Exceptional Items |
50.87 |
42.65 |
49.91 |
41.10 |
48.85 |
|
|
|
|
|
|
|
|
Exceptional Items |
- |
- |
- |
- |
- |
|
PBT |
50.87 |
42.65 |
49.91 |
41.10 |
48.85 |
|
|
|
|
|
|
|
|
Tax Expenses |
12.42 |
10.63 |
12.12 |
10.09 |
12.92 |
|
PAT |
38.45 |
32.02 |
37.79 |
31.01 |
35.93 |
PROFIT AND LOSS STATEMENT (₹ in crores)
|
|
Mar-21 |
Mar-22 |
Mar-23 |
|
Revenue from Operations |
843.99 |
1,081.47 |
1,241.01 |
|
Other Income |
7.65 |
8.17 |
7.17 |
|
Total Income |
851.64 |
1,089.64 |
1,248.18 |
|
|
|
|
|
|
Operating Expenses |
566.73 |
732.97 |
849.70 |
|
Gross Profit |
284.91 |
356.67 |
398.48 |
|
|
|
|
|
|
Employee Benefits Expense |
87.34 |
109.94 |
124.29 |
|
Other Expenses |
55.60 |
63.83 |
72.54 |
|
EBITDA |
141.97 |
182.90 |
201.65 |
|
|
|
|
|
|
Depreciation and Amortisation Expense |
8.97 |
9.98 |
15.31 |
|
EBIT |
133.00 |
172.92 |
186.34 |
|
|
|
|
|
|
Finance Costs |
0.78 |
0.91 |
1.81 |
|
EBT before Share of Profit/(Loss) of Joint Venture and Associates |
132.22 |
172.01 |
184.53 |
|
|
|
|
|
|
Share of Profit/(Loss) of Joint Venture and Associates |
- |
- |
- |
|
EBT before Exceptional Items |
132.22 |
172.01 |
184.53 |
|
|
|
|
|
|
Exceptional Items |
- |
- |
- |
|
EBT |
132.22 |
172.01 |
184.53 |
|
|
|
|
|
|
Tax Expense |
31.62 |
43.17 |
45.25 |
|
PAT Non-Controlling Interests |
100.60 |
128.84 |
139.28 |
|
|
|
|
|
|
Non-Controlling Interests |
- |
- |
- |
|
PAT |
100.60 |
128.84 |
139.28 |
|
|
|
|
|
|
EPS |
|
|
|
|
Basic |
26.19 |
33.49 |
36.24 |
|
Diluted |
26.15 |
33.45 |
36.20 |
|
|
|
|
|
|
Number of Shares |
|
|
|
|
Basic |
3.84 |
3.85 |
3.84 |
|
Diluted |
3.85 |
3.85 |
3.85 |
Balance Sheet (₹ in crores)
|
|
Mar-21 |
Mar-22 |
Mar-23 |
|
ASSETS: |
|
|
|
|
Non-Current Assets: |
|
|
|
|
Property, Plant and Equipment |
224.43 |
314.74 |
343.88 |
|
Right-of-Use Assets |
2.18 |
2.02 |
27.18 |
|
Capital Work-in-Progress |
27.75 |
6.09 |
61.14 |
|
Other Intangible Assets |
1.77 |
3.04 |
3.01 |
|
Finance Assets: |
|
|
|
|
Investments |
1.02 |
1.05 |
1.05 |
|
Other Financial Assets |
13.65 |
- |
- |
|
Total Non-Current Assets |
270.80 |
326.94 |
436.26 |
|
|
|
|
|
|
Current Assets: |
|
|
|
|
Financial Assets: |
|
|
|
|
Investments |
58.71 |
87.00 |
32.11 |
|
Trade Receivables |
169.46 |
189.54 |
211.47 |
|
Cash and Cash Equivalents |
9.16 |
15.74 |
13.49 |
|
Other Bank Balances |
18.06 |
2.26 |
2.88 |
|
Other Financial Assets |
10.79 |
9.54 |
9.89 |
|
Current Tax Assets |
2.01 |
4.09 |
4.93 |
|
Other Current Assets |
7.53 |
21.92 |
23.91 |
|
Total Current Assets |
275.72 |
330.09 |
298.68 |
|
|
|
|
|
|
Total Assets |
546.52 |
657.03 |
734.94 |
|
|
|
|
|
|
EQUITY AND LIABILITIES: |
|
|
|
|
Equity: |
|
|
|
|
Equity Share Capital |
7.69 |
7.70 |
7.66 |
|
Other Equity |
426.18 |
528.49 |
588.71 |
|
Equity Attributable to the Owners |
433.87 |
536.19 |
596.37 |
|
|
|
|
|
|
Non-Controlling Interest |
- |
- |
- |
|
Total Equity |
433.87 |
536.19 |
596.37 |
|
|
|
|
|
|
Liabilities: |
|
|
|
|
Non-Current Liabilities: |
|
|
|
|
Financial Liabilities |
|
|
|
|
Borrowings |
1.01 |
0.21 |
- |
|
Lease Liabilities |
0.12 |
0.12 |
3.84 |
|
Deferred Tax Liabilities |
5.37 |
7.86 |
10.49 |
|
Total Non-Current Liabilities |
6.50 |
8.19 |
14.33 |
|
|
|
|
|
|
Current Liabilities: |
|
|
|
|
Financial Liabilities: |
|
|
|
|
Borrowings |
0.96 |
0.78 |
0.73 |
|
Lease Liabilities |
0.15 |
0.01 |
2.50 |
|
Trade Payables: |
|
|
|
|
Total Outstanding Dues of Micro and Small Enterprises |
1.62 |
1.00 |
1.50 |
|
Other Creditors |
73.57 |
72.72 |
86.91 |
|
Other Financial Liabilities |
8.84 |
16.14 |
9.04 |
|
Other Current Liabilities |
16.74 |
16.45 |
18.44 |
|
Provisions |
4.27 |
5.55 |
5.12 |
|
Total Current Liabilities |
106.15 |
112.65 |
124.24 |
|
|
|
|
|
|
Total Equity & Liabilities |
546.52 |
657.03 |
734.94 |
Cash Flow Statement (₹ in crores)
|
|
Mar-21 |
Mar-22 |
Mar-23 |
|
Net Profit Before Tax |
132.22 |
172.01 |
184.53 |
|
Net Cash from Operating Activities |
102.28 |
127.56 |
146.81 |
|
Net Cash Used for Investing Activities |
-96.01 |
-90.27 |
-65.32 |
|
Net Cash From (Used For) Financing Activities |
-8.22 |
-30.71 |
-83.74 |
|
Net Increase in Cash and Cash Equivalents |
-1.95 |
6.58 |
-2.25 |
|
Cash And Cash Equivalents at The Beginning of The Year |
12.60 |
10.65 |
17.23 |
|
Cash And Cash Equivalents at The End of the Year |
10.65 |
17.23 |
14.98 |
Ratio Analysis
|
|
Mar-21 |
Mar-22 |
Mar-23 |
|
Profitability Ratio |
|
|
|
|
Gross Profit |
33.76% |
32.98% |
32.11% |
|
EBITDA Margin |
16.82% |
16.91% |
16.25% |
|
EBIT Margin |
15.76% |
15.99% |
15.02% |
|
Pre-Tax Margin |
15.67% |
15.91% |
14.87% |
|
Net Profit Margin |
11.92% |
11.91% |
11.22% |
|
|
|
|
|
|
Return on Investment |
|
|
|
|
Return on Asset – ROA |
21% |
21% |
20% |
|
Return on Capital Employed – ROCE |
34% |
35% |
32% |
|
Return on Equity – ROE |
26% |
27% |
25% |
|
|
|
|
|
|
Liquidity Ratio (x) |
|
|
|
|
Current ratio |
2.60 |
2.93 |
2.40 |
|
|
|
|
|
|
Solvency Ratio |
|
|
|
|
Debt to Equity |
0.00 |
0.00 |
0.00 |
|
Interest Coverage Ratio |
171 |
190 |
103 |
Technical Analysis
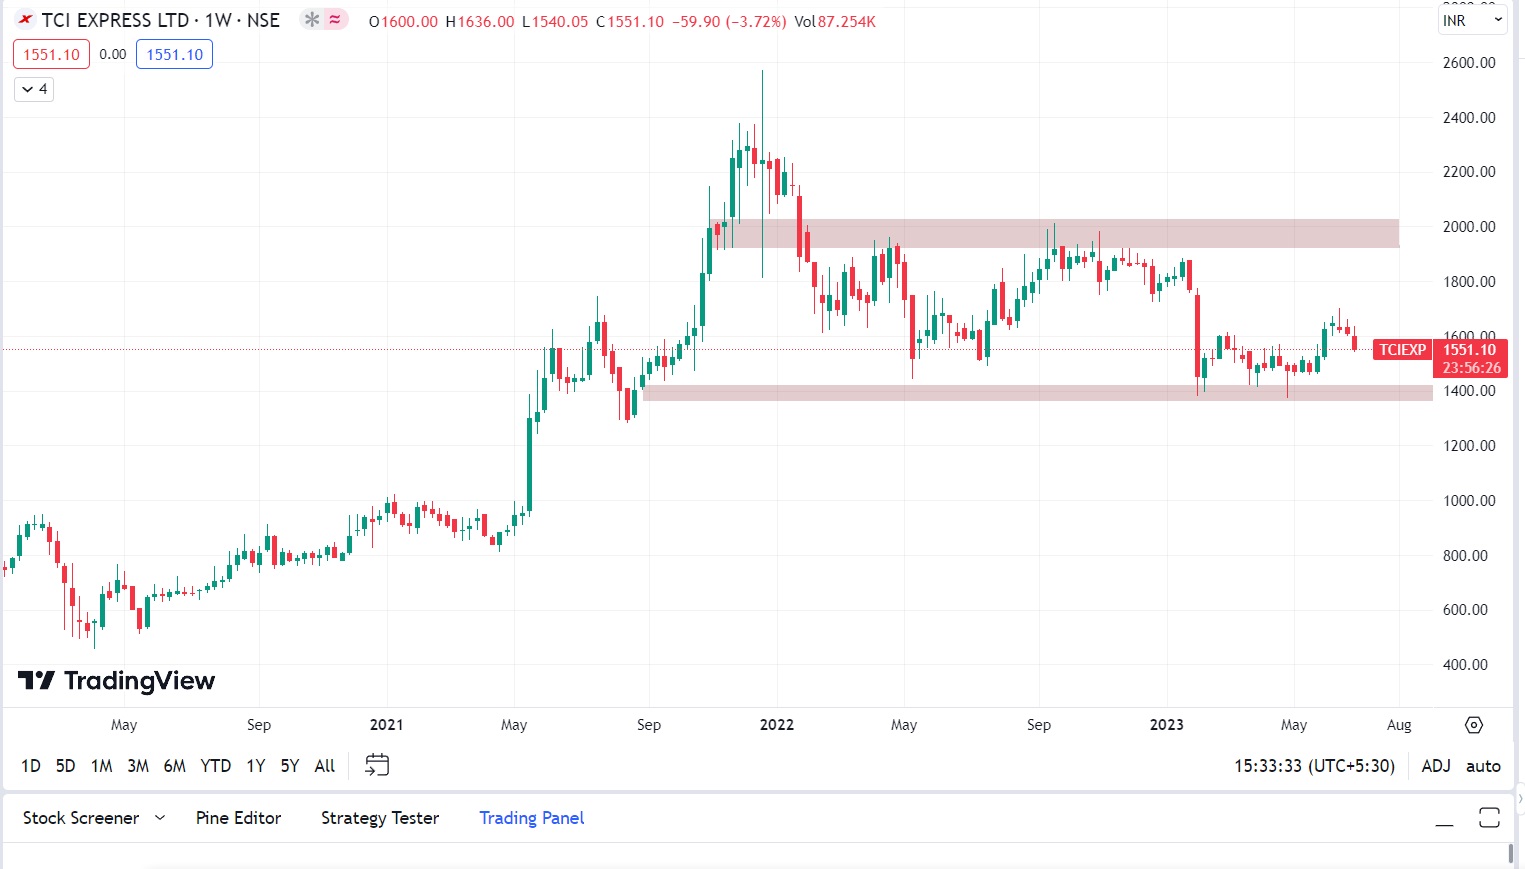
- Stock is in an upward trend on the monthly and weekly chart, ₹1,400 and ₹2,076are support and resistance zone levels.
- One can accumulate this stock at current levels.
CONCALL (Q4FY2023)
- Despite macroeconomic difficulties and inflationary tendencies, achieved double-digit sales growth and profitability margins in FY23.
- Delivered its greatest revenue ever in the fourth quarter of FY23, largely due to robust demand from corporate and MSME sectors and excellent utilisation in recently built sorting centres. estimates a 15–16% increase in revenue in FY24, in line with the 7% economic growth expected for the nation. A 17–18% increase in revenue is anticipated this year, with a 17.5% target EBITDA margin.
- aims to raise prices by at least 2% over the whole year to boost its EBITDA margin by 100 basis points in FY24.
- In FY23, it increased its presence by opening 35 additional branches.
- Plans call for the opening of 50–75 new branches in FY24, with a growth plan that relies on 40–50% more new consumers and a 50–60% increase in current customers.
- The firm intends to establish seven to eight additional automated centres by FY26 to increase margin efficiency. By FY25, the income generated by the railway industry is anticipated to increase by more than 5%. Plans call for revenue growth of 18% to 20% above GDP growth rates. It should take no more than 8 to 9 months to operationalize the next automation centres.
- expects the car industry to develop, as well as the two-wheeler and consumer durable industries.
- The railway industry is highly dependent on small consumers, with the top 10 customers only accounting for 10 to 15% of the total revenue.
- The Railways business's strategy for acquiring consumers is to buy rival air customers and serve them at a cost of one-fourth or one-third with comparable service levels. The small Cold Chain Pharma firm has a clear strategy, and the C2C and Rail companies have bigger aspirations.
- successfully finished a 42.5 crore rupee share repurchase programme.
- received the esteemed GEM 5 Certification in recognition of its dedication to advancing ecologically friendly green building design and construction methods. strategically positioned to take advantage of the Indian economy's tremendous growth potential, supported by robust economic recovery and infrastructural development measures. The firm is unwilling to give up earnings in exchange for more clients at a cheaper price. Although margin expansion is not being slowed down by competition, margins are determined by the status of the national economy. The only pure-play Express business in the nation. Automotive, pharmaceuticals, electronics, lifestyle, and engineering are the main sources of income, with no other sector providing more than 13%.
Recommendation Rationale
- Strong brand recognition and a vast network/infrastructure in the express distribution industry -
- TCI Express provides consumers with last-mile connections because of its well-established brand recognition and robust pan-Indian distribution network. To save expenses, the corporation uses a hub-and-spoke strategy, with 28 express sorting facilities dispersed around the nation serving as hubs and several distribution facilities serving as spokes.
- The company's new Rail Express service, which has already grown to cover 125 routes within a year of its inception, has been seeing great demand among the other new services. The business gains from long-standing connections with its clients and truck providers as well as timely upgrades to its physical and IT infrastructure that allow clients to follow shipments in real-time.
- Asset-light models with a fleet attached assist reduce idle capacity during any downturns.
- There is no fleet listed on the company's records. The company relies on 5,500 containerized cars from affiliated business partners and affiliates to satisfy client demands in the absence of any owned fleet.
- In the case of any business downturns, the asset-light structure of its operations enables it to avoid large fixed expenses (connected to the fleet) and helps TCI Express retain excellent profitability margins.
- Any end-user sector may be protected from demand declines by having a diverse client base.
- Less than 10% of TCI Express's income in FY2023, which was generated by a diverse group of customers, has come from the top ten clients. The company also serves a variety of industries, with revenue shares of between 10 and 15 percent coming from, among others, the automotive, pharmaceutical, textile, engineering products, machinery, and telecom sectors.
- The company is protected from any demand downturns in any market because of its business mix, which also ensures good revenue visibility.
Valuation
- TCI Express Limited has shown revenue growth of 4.95% CAGR for FY2019-2023.
- Net Profit has shown a growth rate of 18% CAGR for FY2019-2023.
- The company’s ROE and ROCE are 25% & 32% for FY2023.
- We estimate the company could generate higher revenue and net profit for the following FY 2024, comparable to the prior year, based on the company's present performance in FY 2023.
- To project income for the fiscal years 2024–2028, we used data from the previous five years (2019–2023).
Estimated Income Statement (₹ in crores)
|
|
Mar-24 |
Mar-25 |
Mar-26 |
Mar-27 |
Mar-28 |
|
|
2025-E |
2024-E |
2026-E |
2027-E |
2028-E |
|
Revenue |
1,431.97 |
1,642.84 |
1,884.79 |
2,162.38 |
2,480.88 |
|
Operating Expenses |
975.05 |
1,118.89 |
1,283.95 |
1,473.36 |
1,690.71 |
|
Gross Profit |
456.92 |
523.95 |
600.84 |
689.02 |
790.17 |
|
Employee Expenses |
143.70 |
164.90 |
189.22 |
217.14 |
249.17 |
|
Other Expenses |
83.65 |
95.99 |
110.15 |
126.40 |
145.04 |
|
EBITDA |
229.58 |
263.07 |
301.47 |
345.49 |
395.96 |
|
Depreciation |
17.44 |
22.29 |
27.77 |
33.95 |
40.96 |
|
EBIT |
212.14 |
240.78 |
273.70 |
311.54 |
355.00 |
|
Financial Cost |
2.06 |
2.34 |
2.66 |
3.03 |
3.45 |
|
EBT |
210.08 |
238.44 |
271.04 |
308.51 |
351.55 |
|
Tax expenses |
51.51 |
58.47 |
66.46 |
75.65 |
86.21 |
|
PAT |
158.56 |
179.97 |
204.58 |
232.86 |
265.34 |
Nayan Nahar Shubham Titvilasi
Equity Research Analyst Equity Research Analyst
Ph: 8149629086 Ph: 7415440968
Email: nayannahar23@gmail.com Email: shubham.titvilasi@gmail.com
Disclaimer: This report is only for the information of our customer Recommendations, opinions, or suggestions are given with the understanding that readers acting on this information assume all risks involved. The information provided herein is not to be construed as an offer to buy or sell securities of any kind.
- Share :


Post a Comment
|
DISCLAIMER |
This report is only for the information of our customers. Recommendations, opinions, or suggestions are given with the understanding that readers acting on this information assume all risks involved. The information provided herein is not to be construed as an offer to buy or sell securities of any kind. ATS and/or its group companies do not as assume any responsibility or liability resulting from the use of such information.