DIC India Limited
DIC India Limited
|
Industry |
Market Price |
Recommendation |
Target |
Time Horizon |
|
Specialty Chemicals |
417.2 |
Avoid |
- |
- |
DIC India Limited - Q3 CY21 Review
DIC India Limited reported a net turnover of Rs 190.1 crore for the quarter ended Sept 30, 2021, when compared to Rs 155.7 crore for the quarter ended Sept 30, 2020. Profit Before Tax and Profit After Tax was Rs 4.1 crore and Rs 3 crore for the quarter ended Sept 30, 2021, as compared to Rs 4.5 crore and Rs 3.4 crore during the corresponding quarter of the previous year.
DIC India Limited - Investment Summary
|
CMP (Rs) |
417.2 |
|
52 Week H/L |
549.9/375.8 |
|
Market Cap (Cr) |
382 |
|
Face Value (Rs) |
10.00 |
|
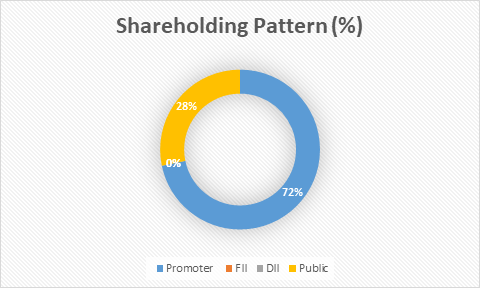
Promoter Holding (%) |
71.75 |
|
Non-Promoter Holding (%) |
28.25 |
|
Total (%) |
100.00 |
Overview
-
2nd largest player in the Indian printing market
-
It has a strong parent company - DIC Corporation
-
Manufacturing plants across the country and wide distribution footprint
-
High Promoter holding of 71.75%
-
Negative revenue growth rate of 6.25% over the last 3 years
-
Zero percent holding by the Institutional investors
DIC India Limited - Quarterly Summary
|
Quarterly |
Sep-2021 |
Jun-2021 |
Mar-2021 |
Dec-2020 |
Sep-2020 |
|
Sales |
187.2 |
164.6 |
173.4 |
164.2 |
153.2 |
|
Other Income |
2.9 |
1.2 |
4 |
2.5 |
2.4 |
|
Total Income |
190.1 |
165.8 |
177.4 |
166.7 |
155.7 |
|
Total Expenditure |
186 |
162.2 |
167.3 |
157.4 |
148.7 |
|
EBIT |
4.1 |
2.4 |
6.1 |
6.8 |
4.5 |
|
Interest |
0 |
0 |
0 |
0 |
0 |
|
Tax |
1.1 |
0.6 |
1.6 |
1.7 |
1.2 |
|
Net Profit |
3 |
1.8 |
4.5 |
5.1 |
3.4 |
Business
DIC India Limited earlier known as Coates of India Limited was incorporated in the year 1947 as the largest manufacturer of printing inks and allied materials. In 2002, the entire stake of the holding company Sun Chemical was transferred to DIC Asia Pacific Pte Limited and in 2004, the company’s name was changed to DIC India Limited. Now the company is one of the largest players in the printing, publishing and packaging industry segment in India. DIC India has a strong parent company- DIC Corporation, Japan. It is one of the leading players in printing inks, organic pigments and PPS compounds in the global market.
The company mainly operates in two segments Printings inks and Lamination adhesives. DIC India’s products find application in various industries like Book Printing, Newspaper Printing, Pharma, Food, Personal Care & Homecare, White Goods, Lifestyle Magazine, and Marketing Brochure. It has the flexibility to offset decreased demand from one industry from another industry’s increasing demand.
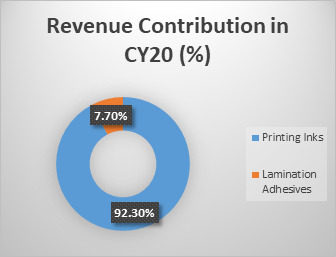
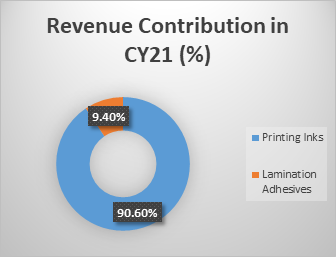
DIC India Limited’s Printing Inks segment offers its products in the broad categories of News inks, Offset inks, Gravure inks, Flexographic inks, and Specialty inks. The company’s Printing inks segment accounted for Rs 551.10 crore, 90.6% of the total revenue from this vertical in CY20, and Rs 730.39 crore, 92.3% of the total revenue in CY19. This vertical saw a reduction in growth of ~24.5% in CY20 over the last year CY19. The company is looking to decrease the revenue contribution in terms of percentage of the total revenue from this segment by focusing on the lamination adhesives segment.
The company’s Lamination adhesives segment has products in two broad categories- adhesive solvent-based and solvent free adhesive and these products suit all types of flexible packaging applications. This segment accounted for Rs 57.15 crore, 9.4% of the total revenue from this vertical in CY20, and Rs 60.73 crore, 7.7% of the total revenue in CY19. This vertical saw a reduction in growth of ~5.9% in CY20 over the last year CY19.
The company has four manufacturing plants in Noida, Kolkata, Bengaluru and Ahmedabad. The company has depots in the cities of Mumbai, Chennai, and Kanpur. DIC India Ltd has a technical centre in Noida. The company sold a 3-acre land parcel in Chandivali, Mumbai to Godrej Properties for a consideration of Rs 153 crore. The company received the first tranche of Rs 102.5 crore in June 2020.
DIC India Limited - Revenue Trend
Topline and Bottomline trend (Crores)
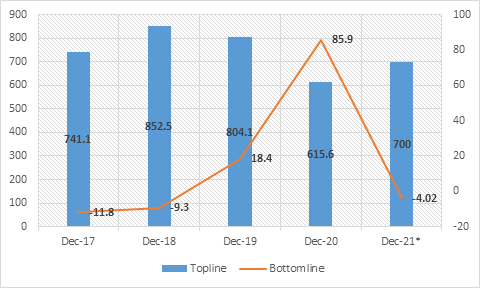
*The company saw a profit from sale of land of 97.62 crore in CY20.
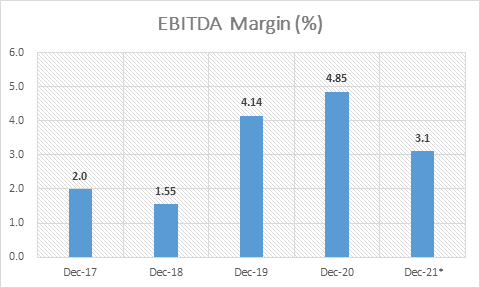
EBITDA Margin Trend (%)
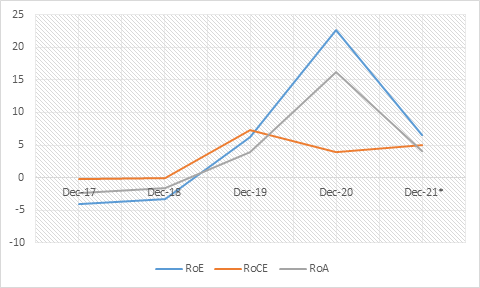
ROE, ROCE, and Asset Turnover trend (%)
Shareholding Pattern (%)
Top 8 Shareholders
|
Rank |
Name |
Holdings % |
|
1 |
DIC Asia Pacific Pte Ltd. |
71.75 |
|
2 |
Hitesh Ramji Javeri |
3.09 |
|
3 |
Harsha Hitesh Javeri |
2.90 |
|
4 |
Bodies Corporate |
2.15 |
|
5 |
Globe Capital Market Ltd. |
1.11 |
|
6 |
IEPF |
0.56 |
|
7 |
Non-Resident Indian (NRI) |
0.54 |
|
8 |
Clearing Members |
0.03 |
Ratio Analysis
|
Year-end December |
Dec-17 |
Dec-18 |
Dec-19 |
Dec-20 |
|
Per share data (Rs) |
|
|
|
|
|
Basic EPS |
-12.8 |
-10.2 |
20.1 |
93.6 |
|
Diluted EPS |
-12.8 |
-10.2 |
20.1 |
93.6 |
|
Cash EPS |
4.1 |
4.3 |
32.3 |
109.6 |
|
BV/Share |
315.7 |
304.9 |
324.6 |
413.3 |
|
P/E* |
- |
- |
16.08 |
4.32 |
|
Dividend/share |
- |
- |
45 |
60 |
|
Net Profit/share |
-12.8 |
-10.2 |
20.1 |
93.6 |
|
Profitability Ratios (%) |
|
|
|
|
|
EBDIT Margin (%) |
1.99% |
1.58% |
4.2% |
4.91% |
|
EBIT Margin (%) |
-0.11% |
0% |
2.79% |
2.49% |
|
PBT Margin (%) |
-2.13% |
-0.7% |
2.2% |
18.22% |
|
Net Profit Margin (%) |
-1.59% |
-1.11% |
2.33% |
14.12% |
|
Return on Assets (%) |
-2.39% |
-1.54% |
3.93% |
16.23% |
|
Total Debt/Equity (X) |
0.1 |
0.2 |
0.1 |
0 |
|
Asset Turnover Ratio (%) |
150.11% |
138.9% |
168.73% |
114.96% |
|
Liquidity Ratios (%) |
|
|
|
|
|
Current Ratio (X) |
2.1 |
1.6 |
2.2 |
2.9 |
|
Quick Ratio (X) |
1.5 |
1.2 |
1.6 |
2.2 |
|
Inventory Turnover Ratio (X) |
6.1 |
6 |
8 |
5.9 |
|
Dividend Payout Ratio NP (%) |
-31.13% |
0 |
0 |
4.8% |
|
Dividend Payout Ratio CP (%) |
96.61% |
0 |
0 |
4.1% |
|
Earnings Retention Ratio (%) |
131.13% |
0 |
0 |
95.2% |
|
Cash Earnings Retention Ratio (%) |
3.39% |
0 |
0 |
95.9% |
|
Valuation Ratios (X) |
|
|
|
|
|
Enterprise Value (Cr.) |
521.1 |
360.3 |
318.7 |
287 |
|
Market Cap/Sales (X) |
0.7 |
0.4 |
0.4 |
0.6 |
|
Price/BV (X) |
1.8 |
1.2 |
1 |
1 |
DIC India Limited - Financial Overview
Profit and Loss Statement (crore)
|
Year-end December |
Dec-17 |
Dec-18 |
Dec-19 |
Dec-20 |
|
INCOME (Cr.) |
|
|
|
|
|
Revenue From Operations [Gross] |
774.4 |
833.3 |
786.6 |
606.1 |
|
Less: Excise/Service Tax/Other Levies |
39.5 |
0 |
0 |
0 |
|
Revenue From Operations [Net] |
734.8 |
833.3 |
786.6 |
606.1 |
|
Total Operating Revenues |
738.3 |
838 |
791.1 |
608.3 |
|
Other Income |
2.8 |
14.6 |
13 |
7.3 |
|
Total Revenue |
741.1 |
852.5 |
804.1 |
615.6 |
|
EXPENSES |
|
|
|
|
|
Cost Of Materials Consumed |
464.1 |
521.7 |
618.6 |
525.2 |
|
Purchase Of Stock-In Trade |
31.7 |
49.5 |
32 |
26.2 |
|
Changes In Inventories Of FG,WIP, And Stock-In Trade |
-3.3 |
-11.6 |
21.7 |
-2.1 |
|
Employee Expenses |
60.2 |
64.4 |
69.7 |
75.4 |
|
Depreciation And Amortization Expenses |
15.6 |
13.3 |
11.2 |
14.7 |
|
Other Expenses |
116 |
118.5 |
122.3 |
83.5 |
|
Total Expenses |
744.8 |
858.4 |
786.7 |
602.3 |
|
Profit/Loss Before Tax |
-15.8 |
-5.9 |
17.5 |
110.9 |
|
Total Tax Expenses |
-4 |
3.4 |
-1 |
25 |
|
Profit/Loss After Tax Before Extraordinary Items |
-11.8 |
-9.3 |
18.4 |
85.9 |
|
Profit/Loss For The Period |
-11.8 |
-9.3 |
18.4 |
85.9 |
*The company saw a profit from sale of land of 97.62 crore in CY20.
Cash Flow Statement (crore)
|
Year-end December |
Dec-17 |
Dec-18 |
Dec-19 |
Dec-20 |
|
Net Profit Before Tax |
-15.8 |
-5.9 |
17.5 |
110.9 |
|
Net Cash From Operating Activities |
-12.8 |
-8.8 |
58.5 |
24.3 |
|
Net Cash (used in)/from Investing Activities |
-3 |
-22 |
-36.8 |
38.2 |
|
Net Cash (used in)/from Financing Activities |
28.2 |
11.5 |
-21.6 |
-44.3 |
|
Net Cash and Cash Equivalents |
12.5 |
-19.2 |
0.1 |
18.1 |
|
Opening Cash & Cash Equivalents |
21.6 |
34 |
14.8 |
14.9 |
|
Closing Cash & Cash Equivalents |
34 |
14.8 |
14.9 |
33.1 |
Balance Sheet (crore)
|
As on 31-12-2020 |
Dec-17 |
Dec-18 |
Dec-19 |
Dec-20 |
|
EQUITIES AND LIABILITIES |
|
|
|
|
|
SHAREHOLDER'S FUNDS |
|
|
|
|
|
Equity Share Capital |
9.2 |
9.2 |
9.2 |
9.2 |
|
Total Share Capital |
9.2 |
9.2 |
9.2 |
9.2 |
|
Reserves and Surplus |
280.6 |
270.7 |
288.7 |
370.2 |
|
Total Reserves and Surplus |
280.6 |
270.7 |
288.7 |
370.2 |
|
Total Shareholders’ Funds |
289.7 |
279.9 |
297.9 |
379.4 |
|
NON-CURRENT LIABILITIES |
|
|
|
|
|
Deferred Tax Liabilities [Net] |
0 |
0 |
0 |
0 |
|
Other Long Term Liabilities |
0 |
0 |
0 |
3.4 |
|
Long Term Provisions |
4.1 |
3.7 |
4.1 |
4.5 |
|
Total Non-Current Liabilities |
4.1 |
3.7 |
4.1 |
8 |
|
CURRENT LIABILITIES |
|
|
|
|
|
Short Term Borrowings |
35 |
50.7 |
35.1 |
0 |
|
Trade Payables |
136.1 |
192.2 |
110.8 |
111.9 |
|
Other Current Liabilities |
26.2 |
75 |
19.2 |
27 |
|
Short Term Provisions |
0.7 |
1.7 |
1.6 |
2.8 |
|
Total Current Liabilities |
198 |
319.7 |
166.8 |
141.7 |
|
Total Capital And Liabilities |
491.8 |
603.3 |
468.9 |
529.1 |
|
ASSETS |
|
|
|
|
|
NON-CURRENT ASSETS |
|
|
|
|
|
Fixed Assets |
60.4 |
60.3 |
60.7 |
80.3 |
|
Total Non-Current Assets |
80.1 |
95 |
97.4 |
118.2 |
|
CURRENT ASSETS |
|
|
|
|
|
Total Current Assets |
411.8 |
508.2 |
371.4 |
410.8 |
|
Total Assets |
491.8 |
603.3 |
468.9 |
529.1 |
Industry Overview
Indian economic performance was severely affected by Covid-19 and related lockdown. The Q1 of FY21 saw a severe drop in demand because of lockdown and destabilization of the supply chain. The lack of demand affected all industries including the printing ink and packaging segment. The demand for packaged food items recovered in the Q2 of FY21 and with this the flexible packaging segment had a quick recovery and settled at near Pre Covid-19 levels. The publication ink took a long time to recover because of the severe drop in circulation, textbook printing, tourism, and ticketing.
The printing industry has an important place in the chemical industry. India is one of the rapidly growing printing markets globally because of the expanding domestic print markets. The Indian printing ink market has registered strong growth in recent years. This industry has over 550 manufacturers and a large number of players are in the unorganized sector. The sector was valued at INR 55 billion in FY20 and the market registered a CAGR of 7.5% during the last 10 years. The Packaging segment is expected to grow at 1.5X GDP in the long run supported by economic survival. As per an estimate by Goldman Sachs, the Indian economy is expected to grow at 9.8% in FY23.
The Adhesives segment is also continued to grow at 1.5X GDP in the long run. The Bureau of Indian Standards (BIS) and FSSAI have issued a ban on the usage of Toluene, a solvent used in paint thinners and the adhesive industry. The players in the segment adapted accordingly. The adhesive industry is slowly shifting towards the usage of solvent-free adhesives. The whole sector faces headwinds in the form of increasing raw material prices both on the domestic and international front.
The Printing ink sector witnessed acquisitions and collaborations in the last 10 to 15 years. Recently, some players have increased their production capacity. The top 6 players in the segment account for around 75% of the market share. The Printing ink market and Packaging segment are set to benefit from rapid urbanization, increasing literacy rates, and FMCG sector growth.
Peer Comparison
|
Company Name |
TTM PE |
PB Ratio |
Debt to Equity |
CMP |
|
DIC India |
26.59 |
1.03 |
0 |
417.2 |
|
Aarti Ind |
55.78 |
11.95 |
0.71 |
988.45 |
|
Gujarat Fluoro |
- |
7.59 |
0.40 |
2405.05 |
|
Atul |
38.51 |
6.75 |
0.03 |
8800.75 |
|
Clean Science |
- |
73.94 |
0.03 |
2448.3 |
Recommendation Rationale
DIC India Ltd, a global leader in printing technology has manufacturing plants in different locations across the country and has a wide distribution footprint. The company has a strong parent company - DIC Corporation with a top share in the global market. The company receives support from its parent company in terms of finance, technological support, process improvement and understanding of the global printing ink business.
DIC India is the second largest player in the market, marking its presence in the newsprint, publication, and packaging industries. It is increasing its focus on the packaging segment to increase its profitability and to bolster its position in the market by meeting demand from the end-user industry. The company sold its land property in Chandivali, Mumbai to Godrej Properties Ltd, for a consideration of Rs 153 crore in 2020. It does not need any external borrowing over the medium term, even if the company wishes to expand.
The company has followed strict safety practices and started a program DIC Connect with a focus on safe reopening post the lockdown. This helped the company to build a stronger connect with existing and potential customers. The company has the capacity to increase efficiency in its operating segments to remain a preferred supplier of choice.
DIC India took strong productivity measures to drive cost effectiveness. These measures helped the company to increase its focus on productivity and performance. The company’s procurement team aligned itself with the global sourcing team to leverage the Group’s purchasing power, and to get a cost advantage while buying raw materials. The company has a regional technical centre in Noida and it focuses on portfolio innovation aligning with emerging market needs. This enables the company to update its product portfolio as per the market needs with an emphasis on cost and performance. DIC India is also making use of the digital space to achieve operational excellence, ease of operations and reduce response time. Its marketing team is using the Digital First Approach to reach out to its customers through a series of programs and initiatives.
The whole industry faces challenges in the form of supply chain disruption - both domestic and global, increased raw material costs, weak demand pattern, increasing competition, disturbances in global freight movement, and high international logistic costs. This industry is vulnerable to strict regulations by the regulators.
The company is looking to increase its customer base in both business segments, thereby reducing the revenue dependency on the top customers. The company is also actively trying to increase revenue from the adhesives segment by increasing products in its portfolio and by increasing the customer base.
Valuation
DIC India over the past 3 years has shown a negative revenue growth rate of 6.25%. It has a low EBITDA margin of 2.59% over the last 5 years. The company had a negative EPS in CY17 and CY18. It had a high EPS in the last year, as it received cash proceeds from the sale of the land in Mumbai. The company is currently trading at a P/B ratio of 1.03. We calculate the 3-year average EPS of the company at 34.5, while the sector P/E is 13.79. The company saw a negative EPS in two years out of past 4 years. The company has given a dividend of Rs 45 and Rs 60 in CY19 and CY20 respectively. The company does not have any institutional investors’ participation.
- Share :


Post a Comment
|
DISCLAIMER |
This report is only for the information of our customers. Recommendations, opinions, or suggestions are given with the understanding that readers acting on this information assume all risks involved. The information provided herein is not to be construed as an offer to buy or sell securities of any kind. ATS and/or its group companies do not as assume any responsibility or liability resulting from the use of such information.